Introduction
It’s no secret that standard C++ is stuck in the ‘70s in terms of human-machine interaction. There is a console input-output with a handful of control characters and that’s basically it. You can use tabulation, a carriage return and, if you’re lucky, a bell signal. Such “advanced” interaction techniques of VT100 like text blinking, underscoring or coloring are out of reach. Of course, it’s possible to directly access some platform-specific API, but they differ quite a lot across platforms and are usually rather hostile to C++ idioms. InterfaceKit of BeOS was AFAIK the only native C++ graphics API. Some 3rd party library and/or middleware could serve as an abstraction layer, but this automatically brings a bunch of problems with building and integration, especially for cross-platform software. So, displaying a simple chart or a cat photo becomes an interesting quest instead of a routine action.
At this moment there’s a proposal to add standardized 2D graphics support to C++, known as P0267 or simply IO2D. It hasn’t been published as TS yet and there’s some controversy around it, but still, the proposal was proven to be implementable on different platforms and the reference implementation is available for test usage. The paper introduces concepts of entities like surfaces, colors, paths, brushes and defines a set of drawing operations. A combination of available drawing primitives with a set of drawing properties already allows building a quite sophisticated visualization model. Capabilities of the drawing operations generally resemble Microsoft’s GDI+/System.Drawing or Apple’s Quartz/CoreGraphics. The major difference is that IO2D employs a stateless drawing model instead of sequential state setup and execution.
The implementation of the proposed graphics library consists of two major components: a public library interface and a platform-specific backend (or multiple backends). The public interface provides a stable set of user-facing classes like “image_surface”, “brush” or “path_builder” and does not contain any details about the actual rendering process. Instead, it delegates all requests down to the specified graphics backend. The backend has to provide the actual geometry processing, rendering and interaction with a windowing system. To do that, ideally, the backend should talk directly to an underlying operating system and its graphics interfaces. Or, as a “fallback solution”, it can translate requests to some cross-platform library or middleware.
The CPULoad demo
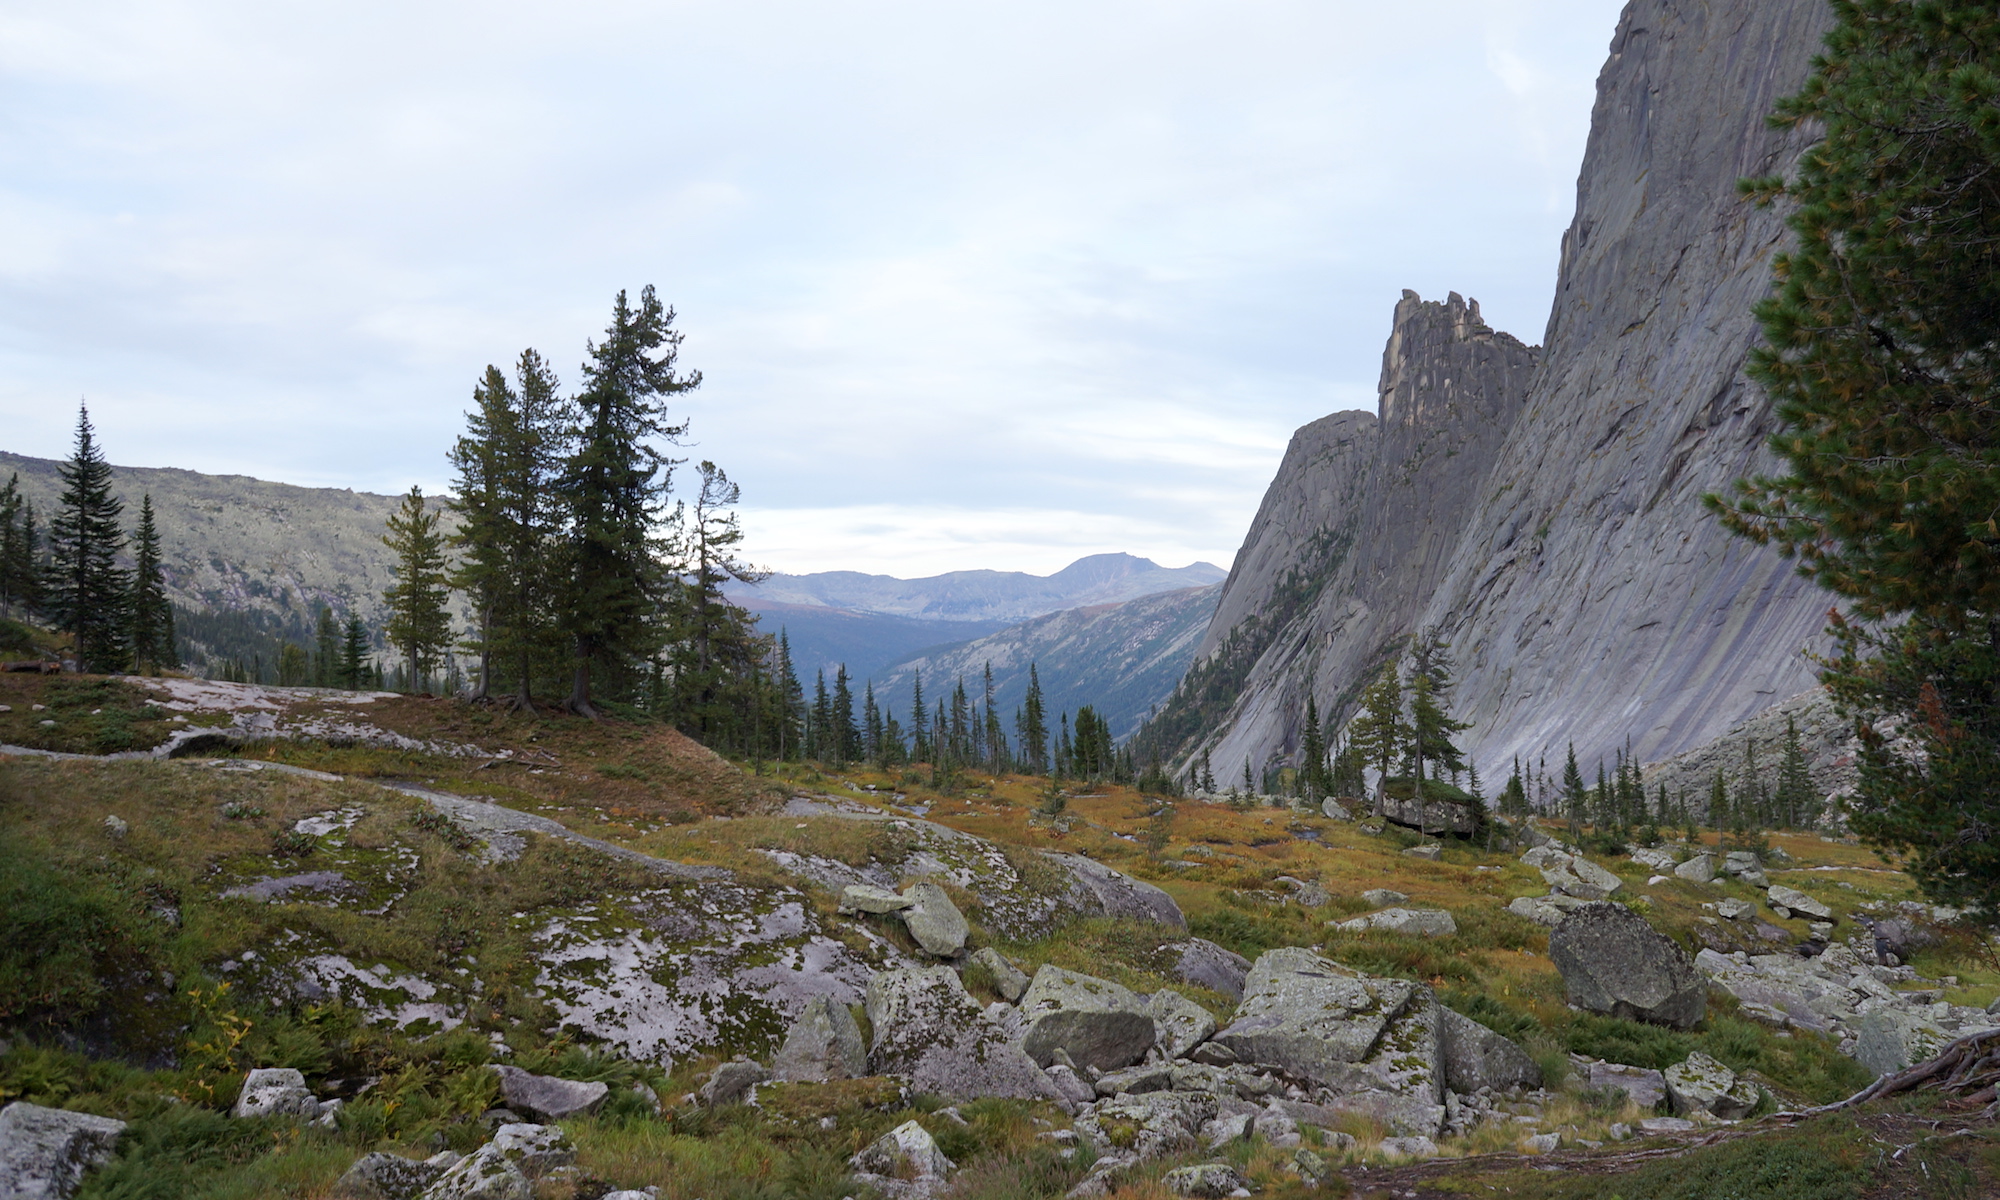
There are several sample projects available in the RefImpl repository, their purpose is to demonstrate capabilities of the library and to show various usage techniques. The rest of this post contains a step-by-step walkthrough of the CPULoad example. This demo shows graphs of CPU usage on a per-core basis, which looks like this:
The sample code fetches the CPU usage information every 100ms and redraws these “Y=Usage(X)” graphs upon a frame update. The DataSource class provides a functionality to fetch new data and access existing entries via this interface:
class DataSource {
public:
  void Fetch();
  int CoresCount() const noexcept;
  int SamplesCount() const noexcept;
  float At(int core, int sample) const noexcept;
  […]
};
The profiler routine is the only platform-specific part, everything else is cross-platform and runs identically on Windows, Mac and Linux.
The data presentation consists of several parts:
– Window creation and redraw cycle;
– Clearing the window background;
– Drawing the vertical grid lines;
– Drawing the horizontal grid lines;
– Filling the graphs with gradients;
– Outlining the graph contours.
Window creation and redraw cycle
This sample uses a so-called “managed output surface”, which means that the caller doesn’t need to worry about the window management and can simply delegate these tasks to IO2D. Only 3 steps are required to have a windowed output:
– Create an output_surface object with properties like desired size, pixel format, scaling and redrawing scheme.
– Provide a callback which does the visualization. In this case, the callback tells the DataSource object to fetch new data and then it calls the drawing procedures one by one.
– Start the message cycle by calling begin_show().
void CPUMeter::Run() {
  auto display = output_surface{400, 400, format::argb32, scaling::letterbox, refresh_style::fixed, 30};
  display.draw_callback([&](output_surface& surface){
    Update();
    Display(surface);
  });
  display.begin_show();
}
Clearing the window background
Paint() operation fills the surface using a custom brush. There are 4 kinds of brushes – a solid color brush, a surface (i.e. texture) brush and two gradient brushes: linear and radial. The solid color brush is made by simply providing a color to the constructor:
brush m_BackgroundFill{rgba_color::alice_blue};
Thus, filling a background requires only a single method call, as shown below. Paint() has other parameters like brush properties, render properties and clipping properties. They all have default values, so these parameters can be omitted in many cases.
void CPUMeter::DrawBackground(output_surface& surface) const {
  surface.paint(m_BackgroundFill);
}
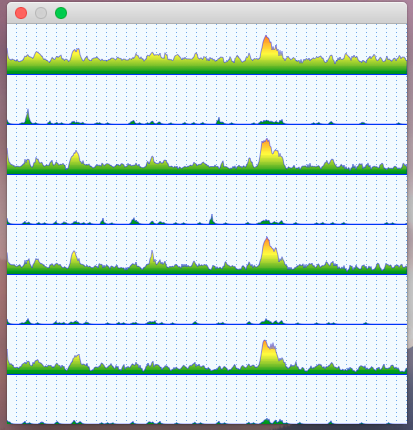
The outcome is a blank window filled with the Alice Blue color (240, 248, 255):
Drawing the vertical grid lines
Drawing lines is a bit more complex operation. First of all, there has to be a path which describes a geometry to draw. Paths are defined by a sequence of commands given to an instance of the path_builder class. A line can be defined by two commands: define a new figure (.new_figure()) and make a line (.line()).
Since it might be costly to transform a path into a specific format of an underlying graphics API, it’s possible to create an interpreted_path object only once and then to use this “baked” representation on every subsequent drawing. In the snippet below, the vertical line is defined only once. Transformation matrices are then used to draw the line at different positions.
Two methods can draw arbitrary paths: stroke() and fill(). The first one draws a line along the path, while the latter fills the interior of a figure defined by the path. Drawing of the grid is performed via the Stroke() method. In addition to brushes, this method also supports specific parameters like “stroke_props” and “dashes”, which define properties of a drawn line. In the following snippet, those parameters set a width of 1 pixel and a dotted pattern.
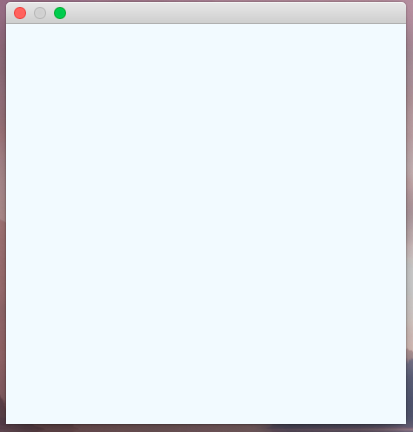
stroke_props m_GridStrokeProps{1.f};
brush m_VerticalLinesBrush{rgba_color::cornflower_blue};
dashes m_VerticalLinesDashes{0.f, {1.f, 3.f}};

void CPUMeter::DrawVerticalGridLines(output_surface& surface) const {
  auto pb = path_builder{};
  pb.new_figure({0.f, 0.f});
  pb.line({0.f, float(surface.dimensions().y())});
  auto ip = interpreted_path{pb};

  for( auto x = surface.dimensions().x() - 1; x >= 0; x -= 10 ) {
    auto rp = render_props{};
    rp.surface_matrix(matrix_2d::init_translate({x + 0.5f, 0}));
    surface.stroke(m_VerticalLinesBrush, ip, nullopt, m_GridStrokeProps, m_VerticalLinesDashes, rp);
  }
}
The result of this stage looks like this:
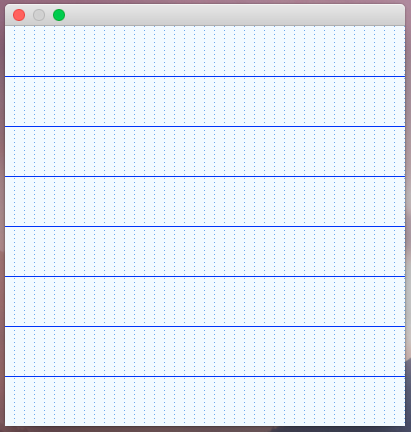
Drawing the horizontal grid lines
The process of drawing the horizontal lines is very similar to the previous description with the only exception. Since horizontal lines are solid, there’s no dash pattern – nullopt is passed instead.
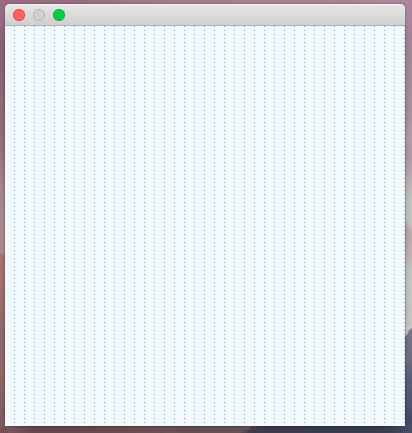
brush m_HorizontalLinesBrush{rgba_color::blue};

void CPUMeter::DrawHorizontalGridLines(output_surface& surface) const {
  auto cpus = m_Source.CoresCount();
  auto dimensions = surface.dimensions();
  auto height_per_cpu = float(dimensions.y()) / cpus;

  auto pb = path_builder{};
  pb.new_figure({0.f, 0.f});
  pb.line({float(dimensions.x()), 0.f});
  auto ip = interpreted_path{pb};

  for( auto cpu = 0; cpu < cpus; ++cpu ) {
    auto rp = render_props{};
    rp.surface_matrix(matrix_2d::init_translate({0.f, floorf((cpu+1)*height_per_cpu) + 0.5f}));
    surface.stroke(m_HorizontalLinesBrush, ip, nullopt, m_GridStrokeProps, nullopt, rp);
  }
}
A fully drawn grid looks like this:
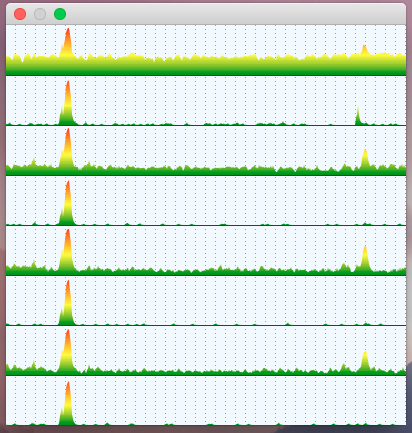
Filling the graphs with gradients
Filling the graph’s interior requires another kind of brush – the linear gradient brush. This kind of brush smoothly interpolates colors along some line. The linear brush is defined by two parameters: a line to interpolate along and a set of colors to interpolate. The gradient in the snippet consists of three colors: green, yellow and red, which represents different levels of usage: low, medium and high. The artificially degenerate line of {0, 0}-{0, 1} is used upon the construction of the gradient, this allows to easily translate and scale the gradient later.
Each data point is used as a Y-coordinate in a path, which is being built from right to left until either the left border is reached or no data remains. Both the path and the gradient are then translated and scaled with the same transformation matrix. In the first case, the coordinates of the paths are transformed, while in the second case the anchor points of the gradient are transformed.
brush m_FillBrush{ {0, 0}, {0, 1}, { {0.f, rgba_color::green}, {0.4f, rgba_color::yellow}, {1.0f, rgba_color::red}}};

void CPUMeter::DrawGraphs(output_surface& surface) const {
  auto cpus = m_Source.CoresCount();
  auto dimensions = surface.dimensions();
  auto height_per_cpu = float(dimensions.y()) / cpus;

  for( auto cpu = 0; cpu < cpus; ++cpu ) {
    auto m = matrix_2d{1, 0, 0, -height_per_cpu, 0, (cpu+1) * height_per_cpu};

    auto graph = path_builder{};
    graph.matrix(m);
    auto x = float(dimensions.x());
    graph.new_figure({x, 0.f});
    for( auto i = m_Source.SamplesCount() - 1; i >= 0 && x >= 0; --i, --x )
      graph.line({x, m_Source.At(cpu, i) });
    graph.line({x, 0.f});
    graph.line({float(dimensions.x()), 0.f});
    graph.close_figure();

    auto bp = brush_props{};
    bp.brush_matrix(m.inverse());
    surface.fill(m_FillBrush, graph, bp);
  }
}
Filled graphs then look like this afterwards:
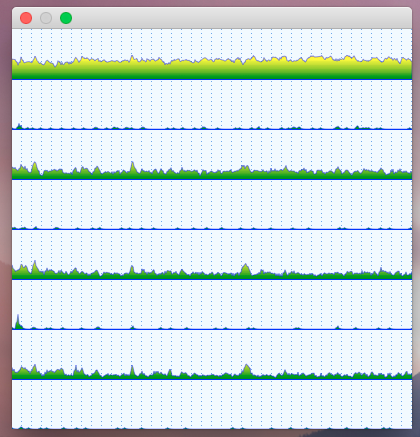
Outlining the graph contours
The graph looks unfinished without its contour, so the final touch is to stroke the outline. There is no need to build the same path twice, as the previous one works just fine. The only difference is that the contour should not be closed, so the path is simply copied before the two last commands. A brush with transparency is used to give the outline some smoothness.
brush m_CountourBrush{ rgba_color{0, 0, 255, 128} };
stroke_props m_ContourStrokeProps{1.f};
[…]
    graph.line({x, 0.f});
    auto contour = graph;
    graph.line({float(dimensions.x()), 0.f});
    […]
    surface.stroke(m_CountourBrush, contour, nullopt, m_ContourStrokeProps);
  }
}
And this last touch gives us the final look of the CPU activity monitor:
Conclusion
In my humble opinion, the 2D graphics proposal might bring C++ a solid foundation for visualization support. It’s powerful enough to build complex structures on top of it – here I can refer to the sample SVG renderer as an example. At the same time, it’s not built around some particular low-level graphics API (i.e OpenGL/DirectX/Mantle/Metal/Vulkan), which come and go over time (who remembers Glide?). What is also very important about the proposal is its implementability – I wrote the CoreGraphics backend in ~3 months on a part-time basis. It can be assumed that writing a theoretical Direct2D backend might take about the same time. While it’s easy to propose “just” a support for PostScript, SVG or even HMTL5, the practical implementability of such extensive standards is very doubtful. Having said that, I do think that the proposal, while being a valid direction, is far from being perfect and needs a lot of polishing.
Here’s the link to the IO2D implementation:
https://github.com/mikebmcl/P0267_RefImpl
Sample code:
https://github.com/mikebmcl/P0267_RefImpl/tree/master/P0267_RefImpl/Samples
Samples screenshots :
https://github.com/mikebmcl/P0267_RefImpl/tree/master/P0267_RefImpl/Samples/Screenshots
I’ve long thought that the io2d effort needs a killer app to help with use cases and help guild development toward a goal.
I think would be ideal for this.
It looks like your project is leaning towards this if you factor out the grid tools and labelling, etc.
Definitely, I would love to add proper labels etc, but there’s a problem – C++ doesn’t support Unicode yet 🙂
In your conclusion I don’t think your comparison of OpenGL/Vulcan with Glide is either fair or accurate. Glide was a vendor specific API for their specific hardware. It was never widely adopted or used. OpenGL and Vulcan are open industry standards developed by members of The Khronos Group that are both more widely supported and more widely used than any other APIs. There is a lot of products and projects that depend on those APIs and they are not going away any time soon. (Unlike Glide.)