This year I took a pause from developing Nimble Commander; during that time, I had some fun with software rendering – it’s actually quite enjoyable when you get fast feedback from your code on the screen and you’re not burdened by a sizeable codebase.
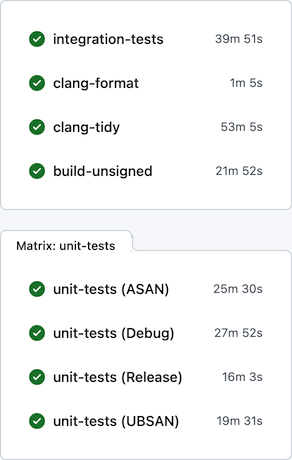
Upon getting back to NC, one thing I realized was that I can’t tolerate the very slow development feedback cycle anymore. On a local machine, build times were tolerable – e.g., on the base M1 CPU the project could be built from scratch in ~5 minutes. On GitHub Actions, however, the situation was rather miserable: the feedback time was somewhere between 30 and 60 minutes, depending on luck:
Generally, I find macOS to be a rather hostile platform for developers (but amazing for users), where just keeping up to date with the constant streak of changes requires a lot of effort. Multiplied by other oddities of the ecosystem, maintenance becomes rather tedious. For example, the “clang-tidy” CI job has to first build all targets via xcodebuild, eavesdropping on the compiler invocations, manually clean the Xcode-specific arguments, and only after all that acrobatics actually execute clang-tidy. Another example of the oddities that make the CI so slow: the “integration-tests” job has to run its Docker containers backed by full QEMU emulation (sloooow), since Apple Silicon didn’t allow nested virtualization up until M3 which is still unavailable on GitHub’s runners.
Previously I tried using a combination of xcodebuild + ccache + GitHub Actions / Jenkins to improve the CI turnaround time, with limited success, and ended up dropping this caching altogether. Microsoft is very generous in giving unlimited free machine time on three platforms to Open-Source projects, which I guess somewhat disincentives optimizing resource usage. Seriously though, thank you, Microsoft! Being able to build/package/test/lint/analyze per each commit on real Mac hardware is absolutely amazing. It’s hilarious that in developing Nimble Commander – an application that targets solely macOS – I’m getting support from Microsoft instead of Apple, but I digress…
This time I focused on two other areas in an attempt to improve the CI turnaround time: minimizing xcodebuild invocations and using unity builds.
Less xcodebuild invocations
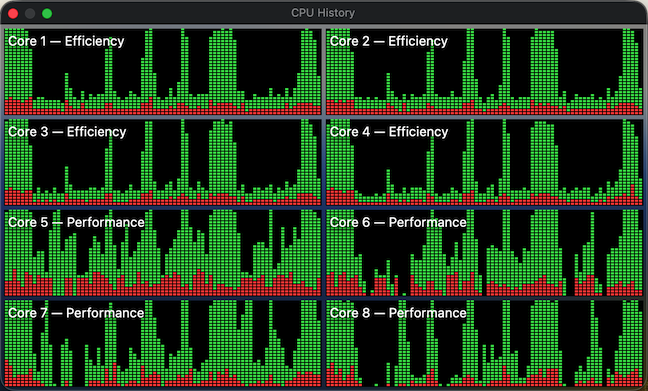
Previously, the scripts that run tests (e.g. “run_all_unit_tests.sh”) tried to do the “right thing”. Targets of the test suites can be identified by their name suffixes (e.g. “UT” for unit tests and “IT” for integration tests), so the scripts asked the build system to provide a list of targets, filtered the list to what they needed, then built those targets one by one and finally ran them. This approach isn’t the most efficient, as it sometimes leaves the build system without enough work to do in parallel. To visualize, here’s how the CPU load previously looked sometimes:
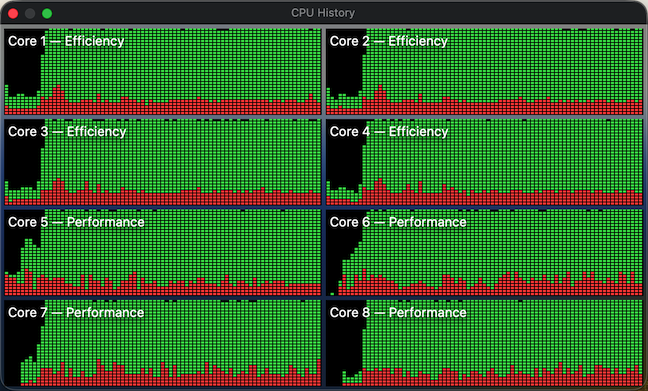
The periods of low CPU usage represent the time when either the build system isn’t running yet or already has fewer targets than available CPU cores to work on in parallel. To improve system utilization, I dropped this “smart” approach and instead manually created explicit “umbrella” schemes that pull in a set of targets, e.g. “All”, “UnitTests” and “IntegrationTests”. Now the CI scripts effectively perform only two invocations of the build system – one to gather the build paths and another to fire up the actual build. In this setup, xcodebuild is able to construct a full build graph that includes every target and load up all CPU cores very efficiently (make sure to pass “-parallelizeTargets”):
Moral of the story? Whenever you try to do the “right” / ”smart” thing, at least verify with perf tools that this smartness doesn’t backfire.
Unity builds
Unity builds are a nice tool that shouldn’t have existed in the first place. Traditionally, they served two purposes: allowing the compiler to optimize better by accessing more context, and speeding up compilation by doing fewer redundant passes. The prior is largely irrelevant today, as we have LTO/WPO working well across all major compilers. For example, Nimble Commander is built as a large monolithic blob where both 1st- and 3rd- party source is statically linked together with link-time optimization. Unity builds, though, are still applicable. Not only are C++20 modules nowhere near production readiness, I doubt they will ever be applicable to NC, given the ample usage of Objective-C++ and occasional Swift interop. On top of that, compilation of C++ code gets slower and slower with each new Standard, simply due to the sheer size of the ever-expanding standard library code that the compiler has to go through over and over again.
Nimble Commander’s codebase consists of several libraries with well-defined boundaries and the main application, which is currently a rather intertwined monolith. I decided to take a pragmatic approach and move only the internal libraries to unity builds for now (that’s about 70% of the implementation files). Below are a few notes specific to applying unity builds in Nimble Commander and the most important – build times before and after.
Sources files were manually pulled into unity builds one by one. As there are two closely related but different languages in the codebase: C++ and Objective-C++, some of the libraries required two unity files: one “.cpp” and another “.mm”. On top of having two language flavors, the sources have to be built twice for two different architectures (x86_64 and arm64) when producing universal binaries. The final distribution of the sources over the unity build files looked like this:
| Unity file | Number of included files |
_Base.cpp |
26 |
_Base.mm |
2 |
_BaseUT.cpp |
13 |
_Utility.cpp |
25 |
_Utility.mm |
34 |
_UtilityUT.cpp |
11 |
_UtilityUT.mm |
12 |
_Config.cpp |
8 |
_Term.cpp |
16 |
_Term.mm |
7 |
_TermUT.cpp |
7 |
_VFS.cpp |
48 |
_VFS.mm |
7 |
_VFSUT.cpp |
9 |
_VFSIcon.cpp |
3 |
_VFSIcon.mm |
15 |
_Viewer.cpp |
18 |
_Viewer.mm |
12 |
_Highlighter.cpp |
5 |
_ViewerUT.cpp |
12 |
_Panel.cpp |
8 |
_Panel.mm |
15 |
_PanelUT.mm |
8 |
_Operations.cpp |
17 |
_Operations.mm |
33 |
_OperationsUT.cpp |
2 |
_OperationsUT.mm |
3 |
_OperationsIT.cpp |
7 |
Quite a lot of files required some touches:
- In Objective-C++ files, localization based on
NSLocalizedString()doesn’t work well with unity builds. Xcode’s automatic strings extraction tool stops processing these calls, seemingly only looking into source files directly compiled by the build system. The solution was to move any calls to this magic function into a single file that’s not included in the unity build. It’s ugly but works. - Any static functions had to be either converted into static member functions or prefixed with a clarifying name. The same applies to static constants, type definitions, and type aliases.
- Usages of “
using namespace XYZ” had to be removed. That’s fine for “normal” C++, but for Objective-C++ it’s rough – Objective-C classes can’t be placed in C++ namespaces, so any references to types inside the same libraries have to be explicit. Inside methods, however, “using namespace XYZ” can still be used. - Any
#definesor#pragmashave to scoped and reverted back. - In test suites, it was possible to cheat a bit and wrap the entire set of test cases in a unique namespace per file – it’s easier and less disruptive.
With these details out of the way, here’s a comparison of different build times, before and after switching to unity builds, measured on a base M1 CPU:
| Before | After | |
| Build the application itself, x86_64+arm64, Debug |
320s | 200s |
| Build the application itself, x86_64+arm64, Release |
298s | 229s |
| Build all targets, arm64, Debug |
212s | 143s |
| Build individual static libraries, x86_64+arm64, Debug |
||
| Base | 3.3s | 1.6s |
| Utility | 10.9s | 4.1s |
| Config | 1.8s | 1.5s |
| Term | 4.5s | 3.2s |
| VFS | 26.7s | 6.8s |
| Panel | 6.1s | 3.2s |
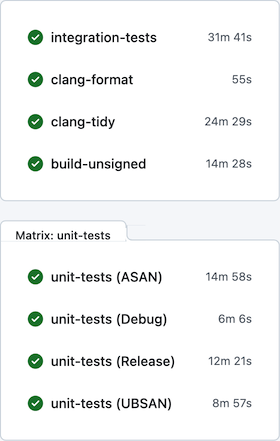
After all these changes, per-commit CI on GitHub Actions looks much better:

